Analyze
Analyze is a one-click auto-triage workflow: point it at a file, folder, .app bundle, .dmg, or .pkg, and it classifies everything with File Miner, then automatically dispatches every tool File Miner suggests for each file it finds. There's no need to read File Miner's suggestions and run each tool by hand — Analyze closes that loop for you and produces a single combined report at the end.
Unlike the other Core Tools, Analyze is not a standalone Rust binary — it's a workflow built on top of the existing tools, available through the PWA and the MCP server.
How It Works
- If the target is a
.dmgor.pkg, dpp Extract unwraps it first (UDIF → HFS+/APFS → XAR → PBZX/CPIO) and Analyze continues against the extracted files. A.zip(the only way to get a directory-based sample like an.appbundle through the web interface's file-only upload widget) is auto-extracted the same way. - File Miner scans the target (a single file, every file in a folder, or every file inside an
.appbundle or extracted container) and classifies each one. A.zip/.dmg/.pkgfound mid-scan — not just as the top-level target, e.g. a sample that's simply a lone archive sitting in its own folder — is extracted the same way and its contents folded into the same run, breadth-first (an archive nested inside an extracted archive also gets unwrapped), capped at 5 nested extractions per run as a guard against zip bombs or pathological nesting. - For each file, Analyze runs every tool File Miner suggests — the same suggestions you'd see running File Miner manually, just dispatched automatically instead of one at a time.
- Results are combined into a single MalChela Summary rollup report (
malchela_summary_<timestamp>.md), saved alongside the individual tool reports it summarizes.
A single sample or small bundle is the intended use case — Analyze auto-dispatches up to 25 files per run. For corpus-scale scans, use MZHash, MZCount, or XMZHash instead.
Over the 25-file cap (routine for a dpp-extracted .pkg payload — a trojanized installer commonly bundles the full legitimate app it trojanized alongside the injected malicious file(s); EvilQuest's sample is 624 files for one Mach-O of actual interest), Analyze doesn't error out or auto-run everything:
- PWA: hands off to File Miner's own interactive table, pointed at the extracted target — real per-row "run this tool" buttons instead of a static summary.
- MCP: returns a file listing directly as text (extension mismatches first, then up to 40 more with a note to call File Miner directly for the rest), since there's no browser to redirect an AI agent to — it can act on the listing immediately.
The MalChela Summary Rollup Report
The rollup leads with a Triage Summary banner, built to answer the questions you'd actually ask first when opening a new sample:
| Section | Source | What It Shows |
|---|---|---|
| File counts | File Miner | Total files analyzed, with duplicate content (identical SHA256 under different filenames — common with carved or exported artifacts) automatically grouped into one write-up instead of repeats |
| Flagged malicious | FileAnalyzer + Threat Intel Query | VirusTotal verdicts, cross-referenced from both sources so Mach-O samples get the same coverage as PE (FileAnalyzer isn't suggested for Mach-O files, so Threat Intel Query is what catches those) |
| Malware tags | Threat Intel Query | Family/tag names pulled from Threat Intel Query's multi-source lookups, for files that were flagged malicious |
| MITRE ATT&CK findings | mStrings | Total match count, broken down by tactic |
| Filesystem / Network IOCs | mStrings | Dropped filenames, paths, and network indicators surfaced during string extraction. Network indicators are shown defanged (hxxp://, [.]) |
| Multi-layer obfuscation | mStrings | Flagged when a detection only fired after peeling multiple layers of base64 re-encoding — a single decode is routine, but repeated re-encoding is itself an evasion tell |
| Flags / Indicators | Mach-O Info, Plist Analyzer, Code Sign Check | Structural findings — RPATH entries, hidden-Dock plists, Team ID mismatches, and similar — attributed to the specific file and tool that flagged them |
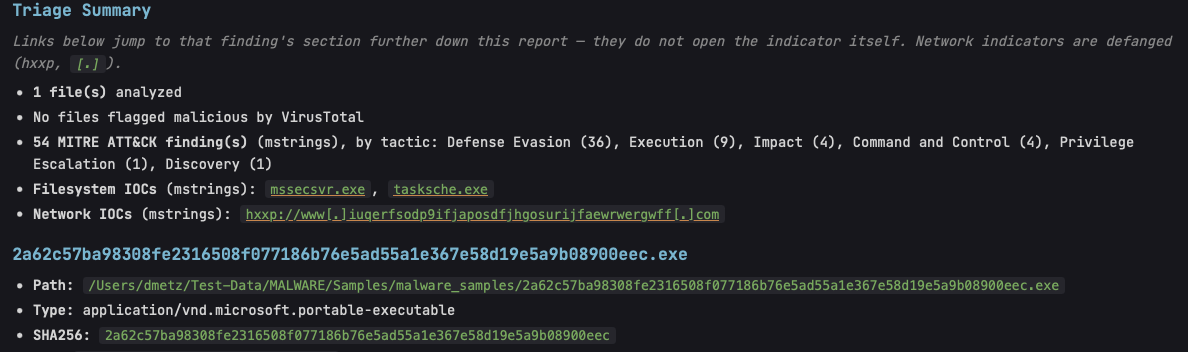
Every filename and IOC in the Triage Summary is a link that jumps straight to that finding's section further down the same report — not out to the indicator itself, which is exactly why network indicators are defanged: the link target is always an internal anchor, but the displayed text shouldn't read like a live, clickable URL regardless.
Below the summary, each file gets its own section with every tool's actual formatted report embedded — real tables and headers pulled from each tool's own Markdown output, not raw console text. The rollup reads cleanly whether you're viewing it in the PWA or opening the file directly.
Save to Case
Analyze's Save to Case control matches every other tool panel — a checkbox and case dropdown, opt-in. When enabled, every tool Analyze dispatches saves its report to the case (and registers it in case.yaml, so it shows up in the case browser), and the rollup itself is saved to:
saved_output/cases/<case_name>/analyze/
When no case is selected, individual tool reports still land in their normal default locations (e.g. saved_output/mstrings/), and the rollup is saved to:
saved_output/analyze/
Analyze dispatches nsrlquery, Threat Intel Query, and FileAnalyzer's VirusTotal check automatically along with everything else — with Offline Mode enabled, those tools skip their network call cleanly and the rollup still completes normally, just without the results that require connectivity.
PWA Usage
Click the Analyze button in the top toolbar, choose a file, folder, .app bundle, .dmg, or .pkg, then configure the run before clicking Run:
- Save to Case — opt-in, same pattern as every other tool panel.
- Concise Output — on by default. Renders the MalChela Summary rollup inline instead of the full expanded per-tool output. Turn it off to see everything each tool produced without opening the saved report separately.
There's also a shortcut straight from File Miner's results table: each row's Analyze button runs every suggested tool for that one file and produces the same rollup, without going through the toolbar button first.
MCP Usage
Analyze is available to AI agents as the analyze tool in the MCP server. Like every other MCP tool, it requires an active case first — call set_case before analyze. This keeps the MCP's behavior consistent across all of its tools rather than special-casing this one workflow; there's no "no case" mode on the MCP side the way there is in the PWA.
dpp_extract is also exposed as its own MCP tool, for when an agent needs the extracted files without Analyze's auto-dispatch — analyze calls it automatically when pointed at a .dmg/.pkg, so calling it directly first isn't necessary for the normal triage flow.
See .claude-plugin/mcp/README.md for MCP setup.